|
MSE vs. Rumensin Exp. 5
COMPARISON OF MSE AND MONENSIN / TYLOSIN AS FEED ADDITIVES FOR FEEDLOT STEERS
(2001)
D. W. Bailey1, D. C. Anderson1,
D. L. Boss1, G. R. Welling1 and D.
D. Kress2
1
Northern Agricultural Research Center, Havre, MT
59501
2
Montana State University, Bozeman,
MT 59717
ABSTRACT:
A study was conducted to compare feedlot performance and carcass characteristics
of steers fed MSE (manufactured by Natur’s Way, Horton, KS), or monensin /
tylosin (M/T) as feed additives. Steers (n=81) were stratified by sire
breed (Angus, Charolais, Piedmontese, Salers, Tarentaise and Hereford) and
randomly allocated to the MSE and M/T treatments. The barley, corn silage, hay
and protein supplement ration was identical for each treatment except for the
feed additives. For the MSE treatment, MSE was added to the ration at a daily
rate of 2.2 lb. MSE per 88,000 lb. of steer body weight (average intake was 12 g
MSE d-1). Steers in the M/T treatment received 300 mg of monensin
per day and 90 mg of tylosin phosphate per day. During the first three 28-day
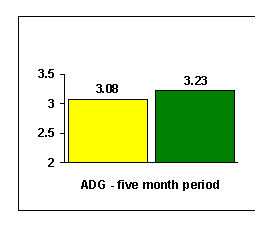
periods, average daily gain of MSE steers (3.37 lb. d-1) was greater
(P < 0.06) than steers in the M/T treatment (3.19 lb d-1). Gains were
similar for both treatments during the last three months (P = 0.3) and for the
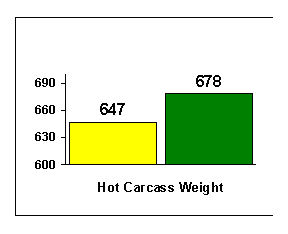
average of the entire five month feeding period (P = 0.12). Hot carcass weight
(P < 0.01), fat thickness at the 12th rib (P < 0.01), and
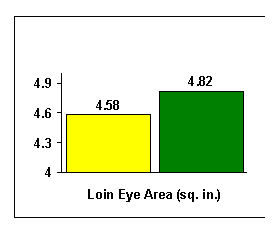
longissimus area (P < 0.04) of the MSE steers were greater than M/T steers.
Longissimus area per unit of carcass weight was similar (P = 0.9) for
both treatments. Marbling (P = 0.2), quality grade (P = 0.4) and yield grade (P
= 0.6) were similar for both treatments. Almost no indications of illness were
observed in either treatment. No steers were treated for bloat, and there were
no condemned livers. In this study, steers fed MSE had heavier carcasses,
greater fat thickness at the 12th rib and larger longissimus
areas than steers fed M/T, however quality and yield grades were similar between
treatments.
THE RESULTS
 Control Control
 MSE MSE
MSE increased ADG overall (P = 0.12)
MSE Increased HCW (P < 0.01)
MSE increased LEA (P < 0.04)
|